
How to Look Up Miami-Dade Jail Population Data
The corrections department publishes the numbers on its Corrections reports page. That page links the Daily Jail Population Statistics report and the PREA reports. The daily report is the primary source for current counts. It updates day by day, so the figures reflect a single date rather than a running average.
The daily report shows a custody count, bookings, releases, average daily population over a trailing period, expected average length of stay, and breakdowns by gender, age, primary offense, and charge status. The numbers on the standing department overview can differ from the daily report, because the overview describes a general range while the daily report captures one day. Read both with the date in mind.
The image below opens the official corrections homepage, the hub for these reports.
From there the daily statistics report and operational reports are a click away.
Miami-Dade Jail Capacity Overview
The system runs four detention facilities. County materials list rated capacity for the two largest and describe the others as part of the four-facility system. The table below uses the capacity figures from a 2025 county matter.
| Facility | Address | Capacity / ADP note |
|---|---|---|
| Metro West Detention Center | 13850 NW 41st Street | Capacity 2,568; ADP about 2,500 in 2025 |
| Turner Guilford Knight | 7000 NW 41st Street | Capacity 1,411; ADP 1,100-1,340 in 2025 |
| Pre-Trial Detention Center | 1321 NW 13th Street | Part of four-facility system; capacity not published |
| Boot Camp Program | 6950 NW 41st Street | Part of four-facility system; capacity not published |
Average Daily Population and Length of Stay
The department describes a standing daily population in the 4,000 to 4,200 range, while a 2024 county legislative matter cited an average daily population of about 4,600 across the four facilities. The December 14, 2025 daily report showed 4,724 people in custody and a 180-day average daily population of 4,849. The same report listed an expected average length of stay of 35.62 days over the prior 180 days. The gap between the standing range and the daily report shows why a single number should always carry its date.
Demographic Breakdown
The daily report breaks the population down by gender and age. As of December 14, 2025, the gender split was 4,242 male, or 89.8 percent, and 482 female, or 10.2 percent. The age chart groups people into buckets: 17 and under, 18 to 24, 25 to 34, 35 to 44, 45 to 54, 55 to 64, and 65 or older.
| Group | Count (Dec 14, 2025) | Percent |
|---|---|---|
| Male | 4,242 | 89.8% |
| Female | 482 | 10.2% |
Pretrial vs Sentenced Population
Most people in the jail are awaiting trial rather than serving a sentence. The December 14, 2025 report listed 3,570 unsentenced, or 75.57 percent, alongside 736 sentenced and 418 partial. The high unsentenced share is a key reason the county tracks length of stay and pretrial release programs.
| Charge Status | Count (Dec 14, 2025) | Share |
|---|---|---|
| Unsentenced | 3,570 | 75.57% |
| Sentenced | 736 | Remainder |
| Partial | 418 | Remainder |
Misdemeanor vs Felony Population
The population skews heavily toward felony charges. On December 14, 2025, the primary offense breakdown showed 4,247 felony, or 89.9 percent, and 362 misdemeanor, or 7.66 percent, with traffic and other categories making up the rest. That pattern fits a system where felonies move through Circuit Criminal and tend to carry longer pretrial stays.
Mental Health and Medical Population
The corrections department provides medical and mental health care to professional standards for people in custody with those needs. The county's replacement jail planning specifically cites medical and mental health care, suicide prevention, and rehabilitative programming as drivers, which signals that a meaningful share of the population needs clinical services. The department does not publish a single public clinical-population figure, so the operational reports and planning documents are the best available context.
National and State Context
Scale is the headline. The corrections department states it operates the eighth-largest jail system in the United States, and county materials call it the largest jail system in Florida. Those rankings, rather than a per-capita rate, are the official framing in the source documents. The four-facility system houses thousands of people on any given day, which places Miami-Dade among the busiest local detention systems in the country.
- National: eighth-largest jail system in the United States.
- State: largest jail system in Florida.
- Local: four detention facilities with a daily population in the thousands.
Population Trends Over Time
The numbers have drifted upward across recent reports. A 2019 replacement-jail report cited an average daily population of about 4,300, with facilities built between 1959 and 1991 needing upgrades for medical and mental health care, suicide prevention, and programming. The 2024 legislative matter cited an average daily population of about 4,600. The December 2025 daily report showed 4,724 in custody and a 180-day average of 4,849. The standing department overview still describes a 4,000 to 4,200 range, which is lower than the late-2025 daily figures.
The image below opens the 2024 replacement jail legislative matter that documents capacity needs.
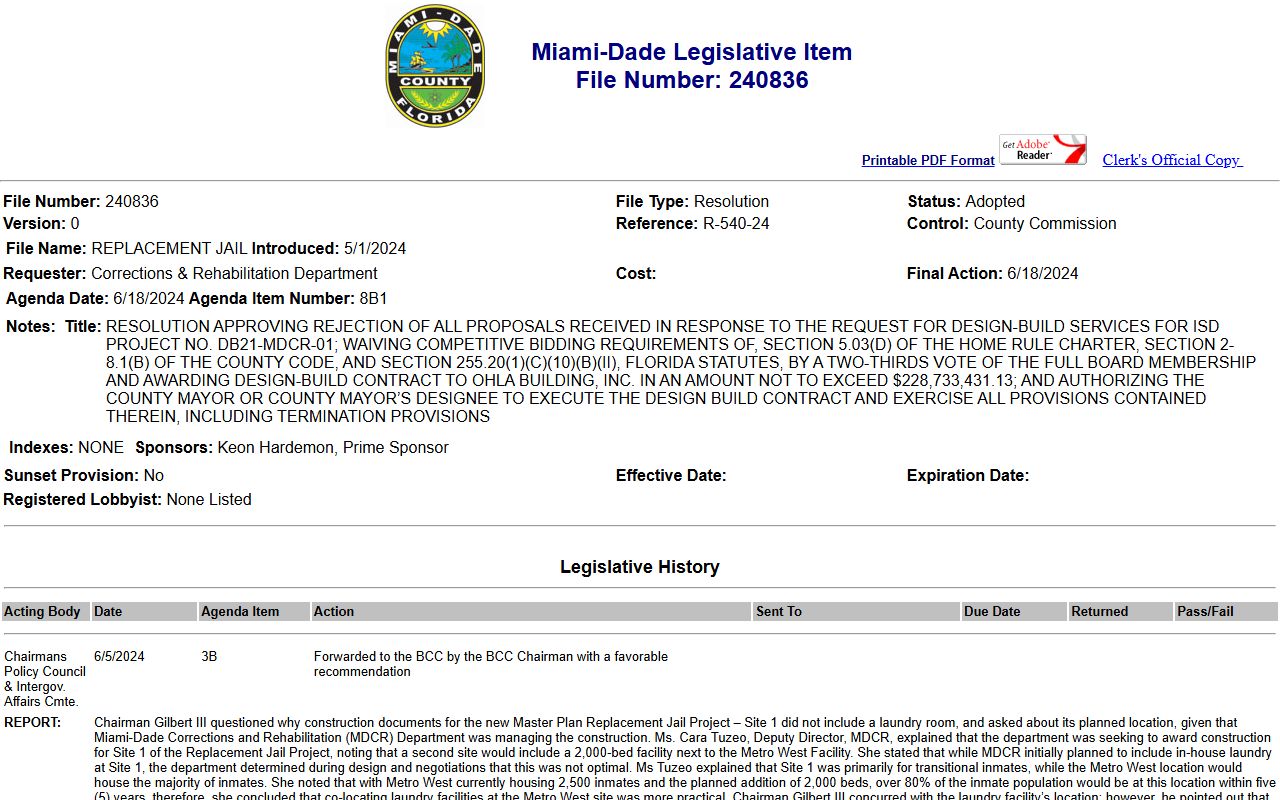
That matter advanced a $228,733,431.13 design and construction contract for the Master Plan Replacement Jail, Site 1, Training and Treatment Center.
Searching for Miami-Dade Inmate Records by Name
This page covers aggregate jail population data, not individual lookups. To find a specific person in custody by name, use the Miami-Dade County inmate records page, which explains the live MDCR In-Custody Search and the fields it returns.
Where the Data Comes From
The figures here come from official Miami-Dade sources. The Daily Jail Population Statistics report carries the custody count, bookings, releases, average daily population, length of stay, and demographic breakdowns. The Corrections reports page links that report along with PREA audit reports. County legislative matters supply the capacity and replacement-jail figures. Each number on this page is tied to its source date, since the population changes daily.